
Using the best technical indicators can make a big difference to the success of your short-term trading strategy. Make sure you’re not using the wrong ones! Read more to find out.
What exactly is a technical indicator?
Technical indicators are mathematical formulae that use price data, such as the opening and closing prices, as well as price highs and lows. Overlays are presented on top of the price chart, while underlays are displayed beneath the candlestick chart.
Any market can benefit from the usage of technical indicators in day trading. Forex trading, commodity trading, indices trading, and crypto trading are all popular short-term trading marketplaces where technical indicators can be used.
Types of technical indicators
We chose three different sorts of technical indicators, each of which serves a distinct function from the others. This means that no information is contradictory, and each technical signal complements the others.
Trend following, momentum, and volatility are the three functions.
3 Best Technical Indicators
The list of what we believe to be the finest technical indicators for day trading is not exhaustive, but it does cover some of the most popular indicators for day trading on short timeframes. You may decide to adjust the parameters on the indicators, use customized indicators, or even design your own technical indicators over time.
- Relative Strength Index (RSI) for Momentum Average
- True Range (ATR) for Volatility
- Moving Average (SMA or EMA) for Trend
1) Moving Averages
What exactly is a moving average indicator? Anyone who has seen a price chart knows that prices swing drastically. By taking the average price over a rolling number of periods, the moving average seeks to smooth out this price activity. The result is a smooth line that follows the candlesticks or price bars on your chart.
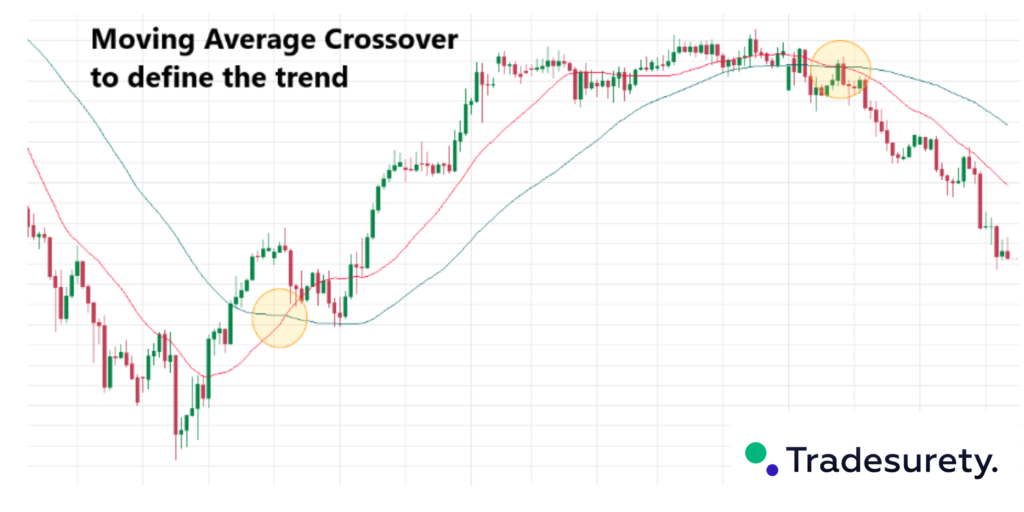
Moving averages usage: The smoothed line facilitates determining market trend easier. If the line slopes upward, the trend is upward; if the line slopes downward, the trend is downward. Moving averages can also generate trade signals when price crosses them or when a shorter term moving average crosses a longer term moving average.
Why is a moving average useful for short-term trading? Moving averages are primarily for trend following. SMAs and EMAs are lagging indicators, which means that the price must first move before the indicator reacts to it. They have the advantage of smoothing out market ‘noise,’ but they might be slow to signal that the trend has altered at turning moments.
While the 50-day and 200-day moving averages are common settings for long-term traders, the indicators will adapt based on the timeframe you are trading. The 20-period moving average will adjust to 20 hours on a one-hour display.
2) Relative Strength Index
What exactly is the RSI indicator? It is an oscillator, which means it displays as an underlay indication and varies between 0 and 100. The indicator’s logic measures the size of ‘up moves’ over ‘down moves,’ therefore the notion is that it compares the relative strength’ of the bulls versus the bears.
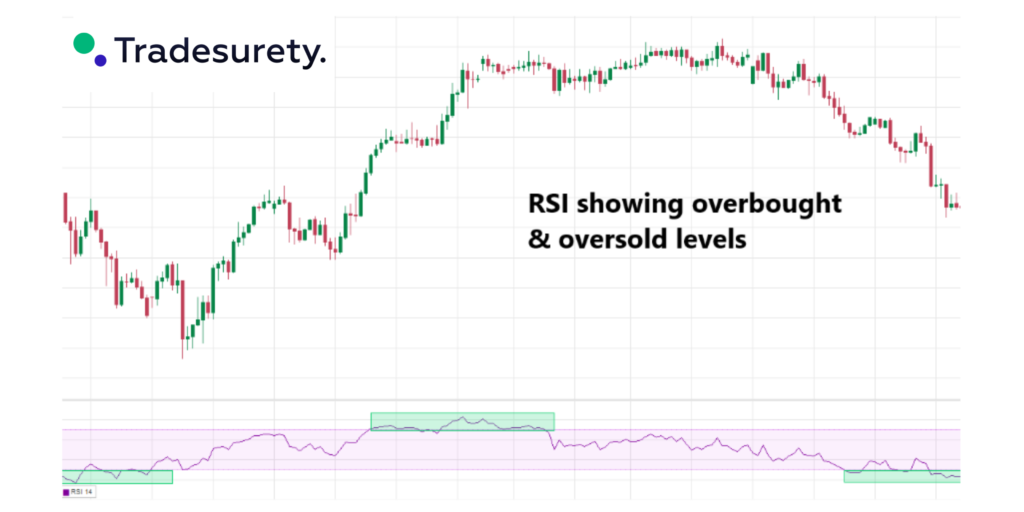
The RSI indicator is to identify overbought and oversold market conditions. That is, price may move too far too rapidly and is ready to revert. Traders will also compare RSI indicator swings to price swings to detect divergence between the two. Divergence is yet another indicator that the present price trend is soon to reverse.
Why it is ideal for short-term trading: Price can change direction quickly in short timeframes. Momentum indicators (such as the RSI) are a leading indicators, which means that they frequently change direction before the price. This can provide traders with an early warning signal to exit a trade before it reverses. The disadvantage is that RSI can produce false signals, implying that a trend will shift when it does not.
3) Average True Range (ATR)
What exactly is the ATR indicator? The Average True Range represents a single number or displayed as an underlay on the chart to show how the value has varied over time. It displays the average number of points moved by a market over a given time period. The most common option is 14, which means it measures across 14 intervals.
The ATR indicator is employed as a measure of volatility, or how much the price of a market has moved over a given period of time. This is helpful information for day traders who are deciding where to put their stop loss and take profit orders. For instance, if a stock or currency deal is projected to continue for several hours, the stop loss should be at least 1X the 1-hour ATR (14).
Why it is useful for short-term trading: As a short-term trader, you may be tempted to enter longer-term transactions as the market moves up and down. The ATR can be used to determine where to establish profit targets and cut losses.
Putting it all together into a trading strategy
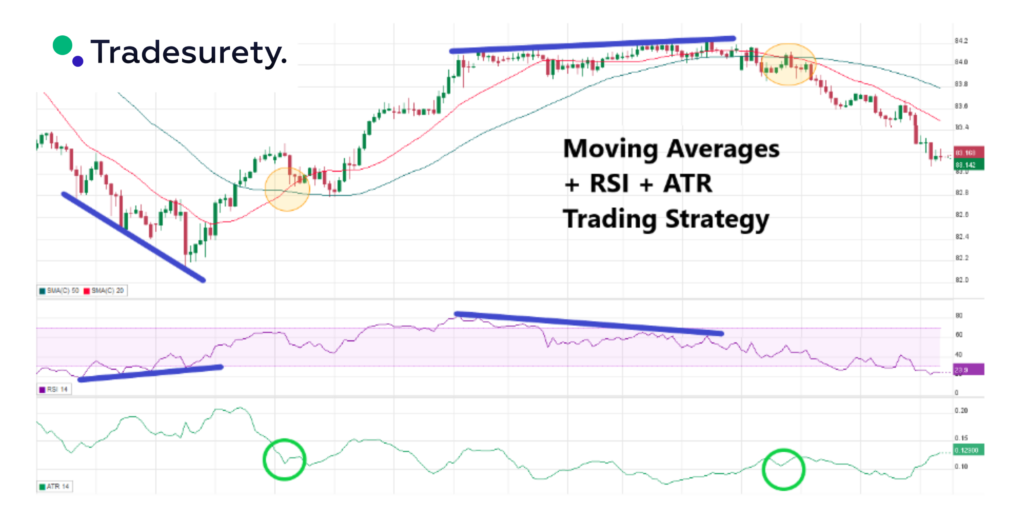
As shown in the chart each technical indicator performs a function, which combined can form part of your day trading rules-based strategy.
Good short-term trading opportunities come about when all three indicators work together.