Trend lines are one of the most common types of technical analysis. But are you drawing them correctly? If not, let me show you how.
There are numerous types of technical analysis used to analyze the markets. And by far the most common is that of support and resistance.
What are Trend Lines?
A trend line is a line drawn between two levels on a chart to express support or resistance, depending on the trend’s direction. The more price respects a specific trend line, the more significant that trendline becomes.
We can easily identify potential areas of increased supply and demand based on these trend lines, which can contribute to a downward or upward pattern in the market.
How to draw Trend Lines?
we’ve discovered that there is a lot of misunderstanding about how and where to draw trend lines. There are two schools of thought on this:
you can draw the trendline from the highs to the lows of a specific candle. Or you can take them from the closing price.
You can do either, but the point is to be consistent in your approach.
It’s pointless to draw a trendline from the high of one candle to the low of another and force it to fit the market. This will most likely result in some inaccurate trading signals.
When drawing trend lines, the first thing to consider is the trend’s direction, from where the price has been to where it is going.
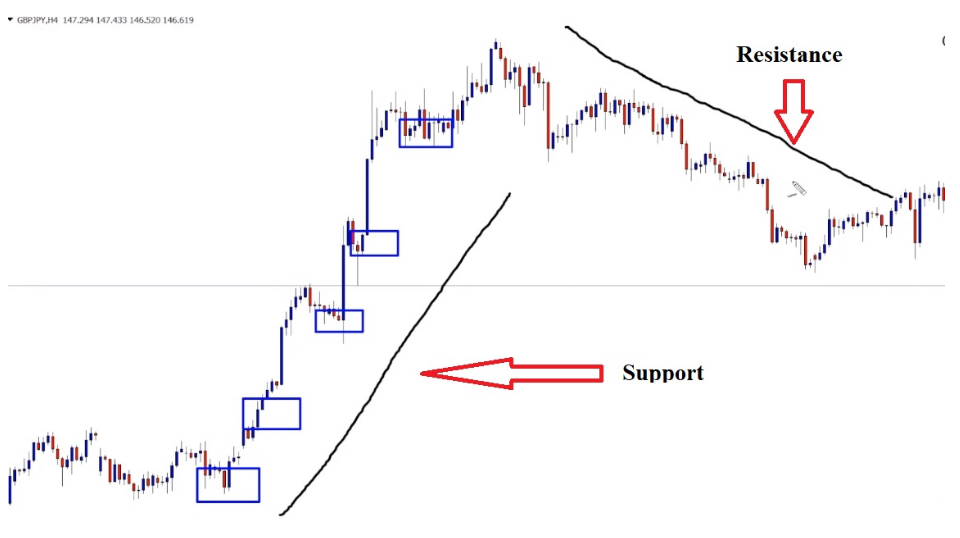
Take a look at the following trend line:

For an up-trending market, the trend line will be placed below the price, acting as support.
If the market is falling, the trendline will be placed where the market price is, acting as resistance.
Where to place the trend line?
One method is to draw trend lines on the extreme points, the highs and lows of a specific candle as determined by the wicks.
The only issue is that the price is quite a distance away from where that particular trendline is drawn. That is also true if you are charting a down-trending market.
The other method is to use the line graph to calculate the closing price. Using the line graph, the price will trade much closer to the trend line, which you will be able to see on the candlesticks.
How to use trend lines in trading?
For starters, trendlines drawn on a long-term chart with the closing price are more effective and reliable. It could be used for breakouts as well as other types of charts.
Second, trend lines can be used as dynamic support and resistance levels that change based on recent price action. The support level will be the uptrend line, while the resistance level will be the downtrend line.
The price could either bounce off the trend line and continue on its current path, or it could break through the trend line and cause a reversal.
However, because these trend lines are similar to standard support and resistance lines, the price does not always bounce perfectly from the moving average.
When a level of resistance or support is broken, prices should move in the direction of the break in the following move. If prices break and then fail to accelerate in that direction, this indicates a false break out.
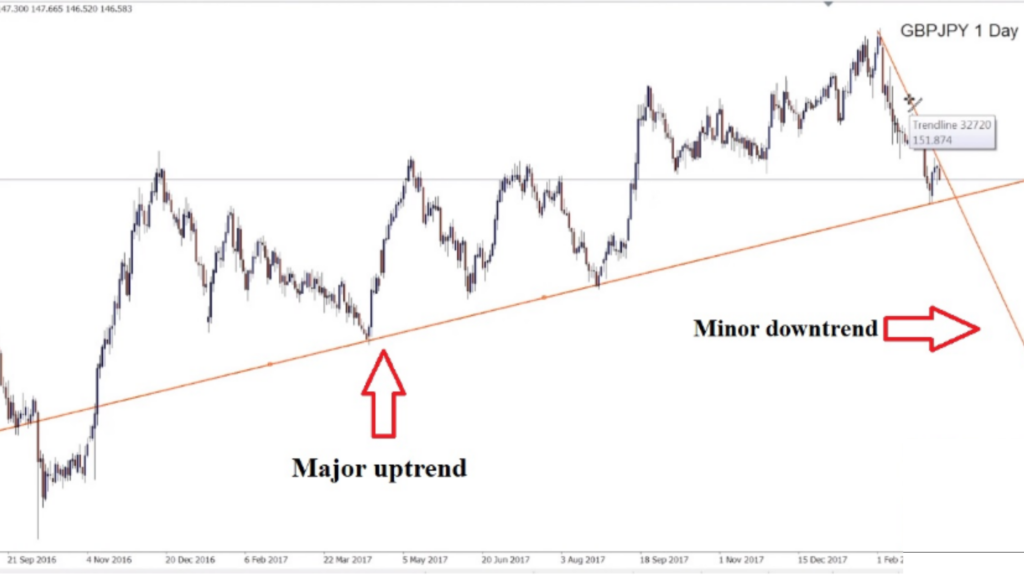
Trendlines, like support and resistance, can be major or minor.
The major trendlines will be visible on the higher timeframe charts. For example, on the daily GBP/YEN chart below, there is a clear uptrend, so a trendline will indicate an upward trend. Because this is a major trendline, it may serve as support.

There may also be minor trends within major trends. For example, on the chart above, there is a minor downtrend within a major uptrend, demonstrating that minor trends can exist within major trends.
Summary:
- A trend line is a line drawn on a chart between two levels to express either support or resistance.
- The trend lines produced by higher time frames are always the most reliable.
- DO NOT draw trend lines and then try to fit them into a market.
- Trend lines can also be used as dynamic levels of support and resistance.


